
The GPUs are still there, but the job is slower
A training job used to take a predictable time per step. This morning, some steps take longer. Processes remain alive, GPUs are visible and no machine has disappeared entirely. Restarting the job may remove the symptom without explaining what caused it.
The delay could come from computation, late input data, network communication or one participant holding up the others. A GPU activity counter cannot distinguish those explanations on its own. Operators need to reconstruct what the job was doing when its progress changed.
NVIDIA introduced Minerva on October 22, 2026 as an AIOps platform, applying automated analysis to operational data. The announced approach connects infrastructure telemetry with AI workloads to detect anomalies and support diagnosis.
This article checks that positioning against public 1.0.1 documentation, reviewed on November 1, 2026. Case studies are reported by NVIDIA. LeCompute has not installed Minerva on a production cluster or independently measured its claimed benefits.
What does an operator actually see?
Operators use Minerva through a web interface. The 1.0.1 UI guide describes dashboards, topology, anomalies, incidents and trends, alongside an assistant called Sherlock. The dashboard below brings health indicators and event logs into one screen.
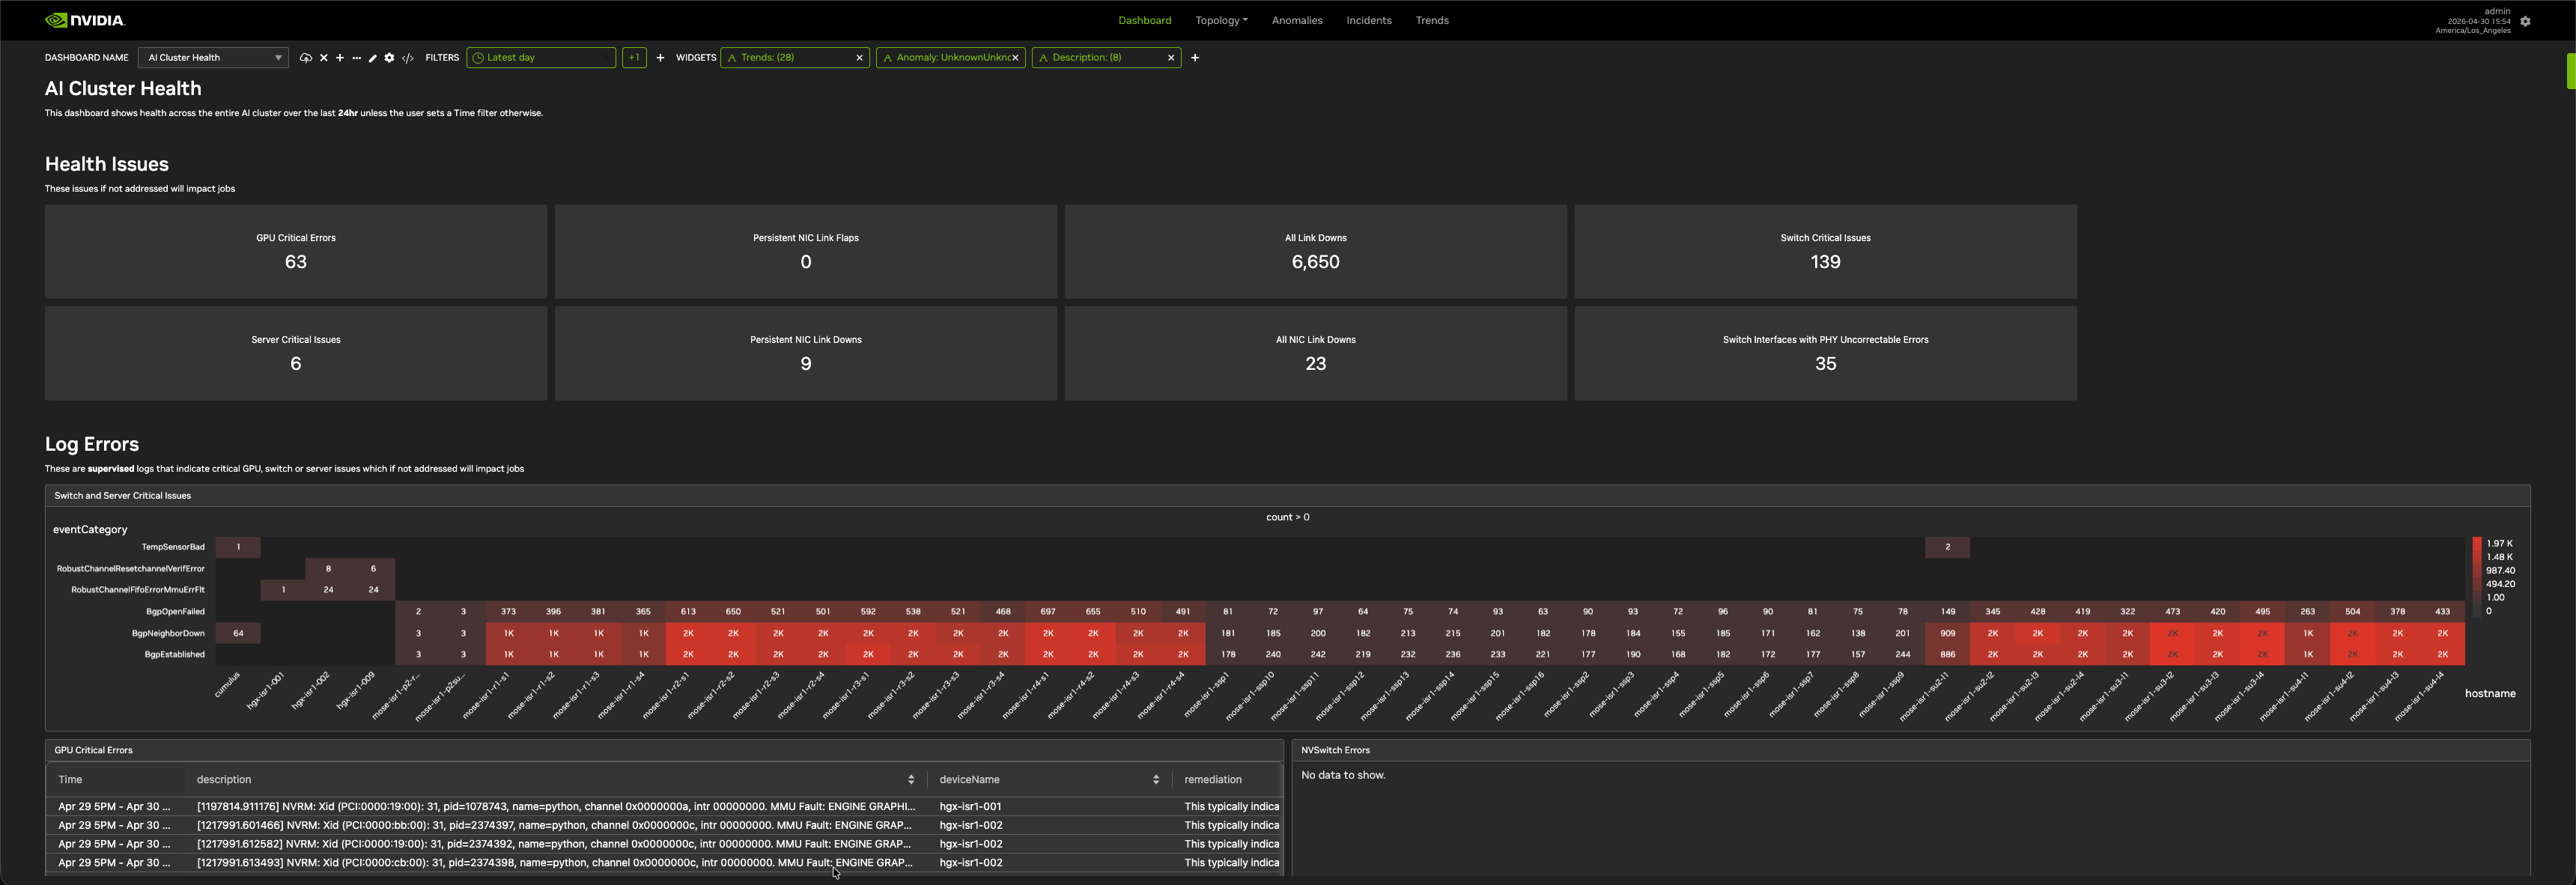
Start with the categories: GPU errors, network interfaces, switches and servers. They give the operations team a shared starting point. For our slow training job, the next step is to locate the affected job and its infrastructure. Topology supports that transition to a network map filtered by job ID, as the documented example below shows. The values in this screenshot belong to NVIDIA’s example, rather than a LeCompute installation.
What GPU utilization does not tell you
A metric is useful only with its definition. NVIDIA’s nvidia-smi documentation defines GPU utilization as the fraction of the sampling period during which at least one kernel executes. A kernel is a function launched on the GPU. This is not a measurement of how much of the device’s total compute capacity becomes useful application output.
A program can run kernels while some resources wait for data. It can repeat work after an error or spend time synchronizing. Activity and application progress must therefore be examined together.
Define the desired service result first. For training, that might be time to a target quality level. For inference, it might be correct requests completed within a latency requirement. Those objectives give hardware metrics their operational meaning.
Here, goodput means throughput counted against the service’s usefulness criteria. Suppose a server completes 100 requests in 10 seconds, but only 80 meet the deadline. Raw throughput is 10 requests per second; goodput under that criterion is 8. These are hypothetical figures, not Minerva measurements. They show why more activity alone does not establish a better service.
Connecting signals to jobs and infrastructure
Telemetry includes measurements and events: temperatures, interface errors, job starts and throughput changes. To combine them, the system needs to identify their source and establish which jobs depended on that source at the relevant time.
Minerva’s network model represents infrastructure objects and their relationships. Topology is more than a connection diagram: it provides context for identifying which workloads might be affected by an anomalous shared component.
Imagine a switch serving several machines. One switch problem can produce symptoms on all of them. A host-only view presents several apparent incidents; the shared dependency supplies a more focused hypothesis.
That hypothesis still needs evidence. Events close in time can have different causes. Timelines, counters and recovery after intervention help test the explanation. Correlation guides an investigation without independently proving causality.
From collection to an actionable incident
The platform architecture separates collection from object modeling, enrichment, analysis, storage and presentation. Collectors need network access to the monitored equipment. This division clarifies where information enters and where the system interprets it.
Instrumentation quality constrains every stage. Missing job identifiers, clock offsets and incorrect interface mappings weaken correlation. An analysis platform cannot reliably recover a relationship that was neither collected nor modeled correctly.
Deploying AIOps therefore includes data engineering. Teams need stable identifiers, suitable collection intervals, historical retention and verified equipment coverage. A populated dashboard does not establish that those prerequisites have been met.
How a network issue can delay the whole group
Distributed training involves accelerators exchanging results. A collective operation such as all-reduce combines contributions and distributes the result to participants. A required exchange delayed by a participant or network path can delay the next stage of the job.
Minerva’s RoCE retransmission example investigates network anomalies through a topology filtered by job ID. It connects those signals with NCCL, NVIDIA’s collective communication library, to locate infrastructure participating in the affected work.
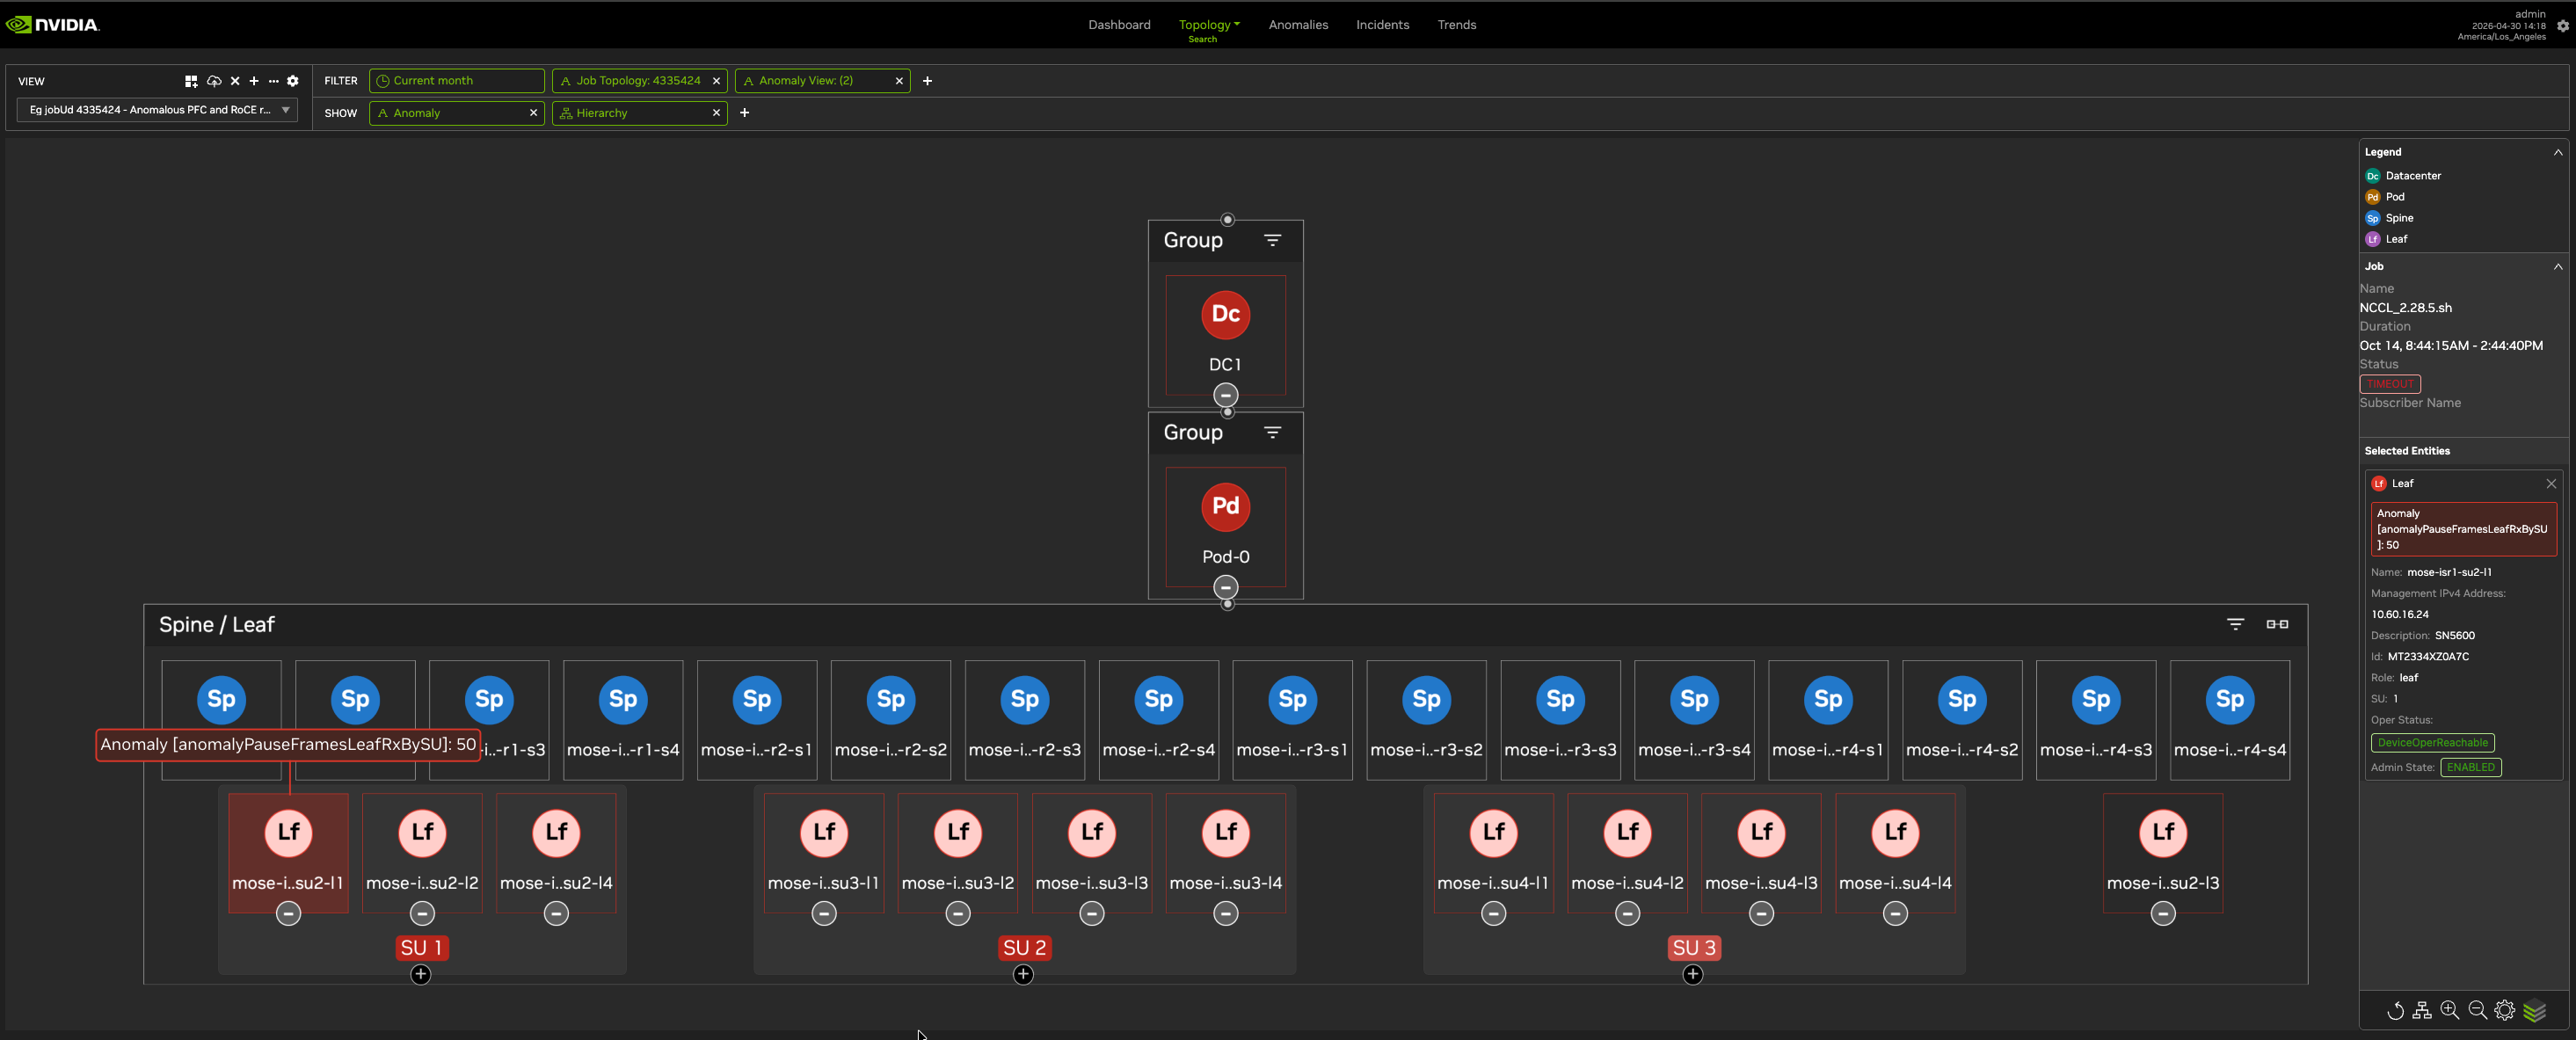
Read the map from the Job Topology: 4335424 filter at the top. Spine / Leaf groups represent network switch layers. Highlighted areas and the right-hand panel help the operator choose equipment and anomalies to investigate. This turns “my training job is slower” into an investigation of that job’s network dependencies, without inspecting every cluster host individually.
Keep the symptoms distinct. Application throughput loss is an observed consequence. Retransmissions indicate exchanges being repeated. Flow-control signals describe network behavior. Examining them together can narrow an investigation; it does not justify replacing a GPU without further evidence.
Other dependencies follow the same reasoning. A faster matrix multiplication cannot deliver input data that has not arrived. A CPU-side delay may begin well before its consequences become visible in GPU activity.
Reducing alert volume while keeping the evidence
A shared incident can trigger alerts across many components. Operators need to determine which alerts describe the same event and which reveal a second problem.
The auto-correlation guide describes grouping by shared metadata, such as a rack or jobId, or by topology relationships. Correlation has a concrete configuration surface, rather than existing only as a conversation with an assistant.
In a published pause-frame case study, NVIDIA reports consolidating 81 anomalies into one incident. That demonstrates a vendor-reported example of grouping. It does not establish a universal detection rate or the false-positive rate on another installation.
Useful consolidation preserves the evidence: affected equipment, time window, original events and grouping context. Without those, operators receive a shorter notification but lose the ability to challenge its explanation.
Evaluation should also count missed incidents. Reducing alert volume by weakening sensitivity is easy. The benefit is detecting relevant incidents while making them faster to understand.
Sherlock queries data; the documented MCP is read-only
The product page describes Sherlock, an assistant for investigating telemetry in natural language. A question about interfaces showing errors during a job can become a useful starting point, provided the operator can inspect the underlying data and query.
MCP, the Model Context Protocol, lets an external assistant discover and call tools. The Minerva 1.0.1 MCP guide describes authenticated, read-only access in beta. It exposes data and topology queries; it does not modify configurations or remediate incidents.
Querying, recommending and acting are different capabilities. Any separate automation tool needs its own evaluation of permissions, validation and rollback. A conversational interface alone does not establish safe closed-loop operations.
The MCP guide also states that access is not tenant-aware: an authorized user can read data across the deployment. Cluster and namespace filters are query filters, not per-user access controls. Connection scope must account for that distinction.
Version 1.0.1 qualifies deployment claims
The product positioning includes SaaS, yet the 1.0.1 release notes state that cloud/SaaS deployments are unsupported. Verify the actual version and offer available instead of inferring availability from the general product page.
Those notes also report that APIs under /minerva/api are unauthenticated by default, requiring an API key before exposure to untrusted networks. They document limitations in tenant data isolation. These version-specific deployment conditions matter before connecting sensitive operational data.
The limitations should not be projected onto every future edition. They explain why technical evaluation needs release notes alongside launch material: capability descriptions and operational defaults are documented in different places.
Where DCGM, Prometheus and Grafana fit
DCGM Exporter exposes GPU metrics for monitoring systems such as Prometheus. Teams can already use those signals and combine them with service and network data.
Minerva’s proposed addition is context and analysis across those signals. Its documentation also describes exporting metrics to external Prometheus, allowing an evaluation alongside existing observability rather than assuming every tool must be replaced.
Ask which investigations remain slow today. Manually joining job identifiers and equipment records is a plausible target for correlation. A single application blocked by one specialized kernel may be better investigated directly with a profiler and system traces.
Hardware scope also matters. Minerva is positioned around NVIDIA infrastructure. Support for each component in a mixed fleet needs confirmation, including the depth of available metrics. A shared interface does not establish equivalent visibility across vendors.
Evaluating useful work preserved
Start with historical incidents whose causes are known. Check whether the platform identifies affected machines and jobs, how many alerts it produces and what evidence supports its suggested explanation. Keep evaluation cases separate from those used to tune thresholds.
In controlled trials, measure time from problem onset to detection, then detection to recovery. Define the start and end of MTTR, mean time to repair or restore, consistently between comparisons. Faster diagnosis cannot remove an unrelated wait for replacement hardware.
Connect incident duration with affected capacity. In a hypothetical case of 32 GPUs reserved for 10 minutes without useful progress, the reservation amounts to roughly 5.33 GPU-hours. That does not measure wasted energy or a Minerva benefit. It shows how a short interruption can immobilize substantial capacity when a group of machines is affected.
Finally, include the cost of observation: collection and storage resources, retention, configuration work and load on monitored equipment. A useful result combines better incident handling with acceptable overhead and improved service outcomes.
Is Minerva relevant to a small deployment?
For one local machine, begin with inference-engine metrics, memory, temperatures and traces targeted to the problem. Cluster correlation needs a stronger justification when distributed dependencies and recurring cross-layer investigations are absent.
For a multi-machine fleet, the case improves when symptoms cross infrastructure layers and team boundaries. Test a known scope, validate access controls and compare complete investigations before broadening collection.
Minerva deserves evaluation when its connections between infrastructure and workloads make incidents explainable sooner. Judge that result through resolved problems and productive work preserved, using the version and operational conditions actually available.
Sources and method
Documentary review completed November 1, 2026, using the Minerva 1.0.1 guide and public announcements. Guide descriptions establish documented behavior; vendor benefits and case studies are not independent LeCompute measurements. Request, goodput and capacity examples are hypothetical.
The October 22 announcement, product page and datasheet establish positioning. The user guide, architecture and network model support the system description.
The auto-correlation guide, 81-anomaly case and RoCE investigation document specific mechanisms and examples, not universal success rates.
The release notes and MCP guide govern the version limitations discussed. Prometheus export, DCGM Exporter and nvidia-smi provide monitoring context. Evaluation recommendations are our analysis.
The documentary screenshots come from the 1.0.1 UI guide and RoCE retransmission case study. They illustrate the interface under discussion, not a LeCompute deployment or measurement. Image filenames are dated April 30, 2026; the exact UI build is unspecified.